
Product tour

This is Nabha, actually running.

Not mockups. Below is a recording of the platform in use, followed by the same screens as stills — live fleet dashboards, a process mimic, a building floor plan, and the device management that infers your tags for you.

Forty seconds through the platform: fleet dashboard → process mimic → device management → building view. No narration, no editing.
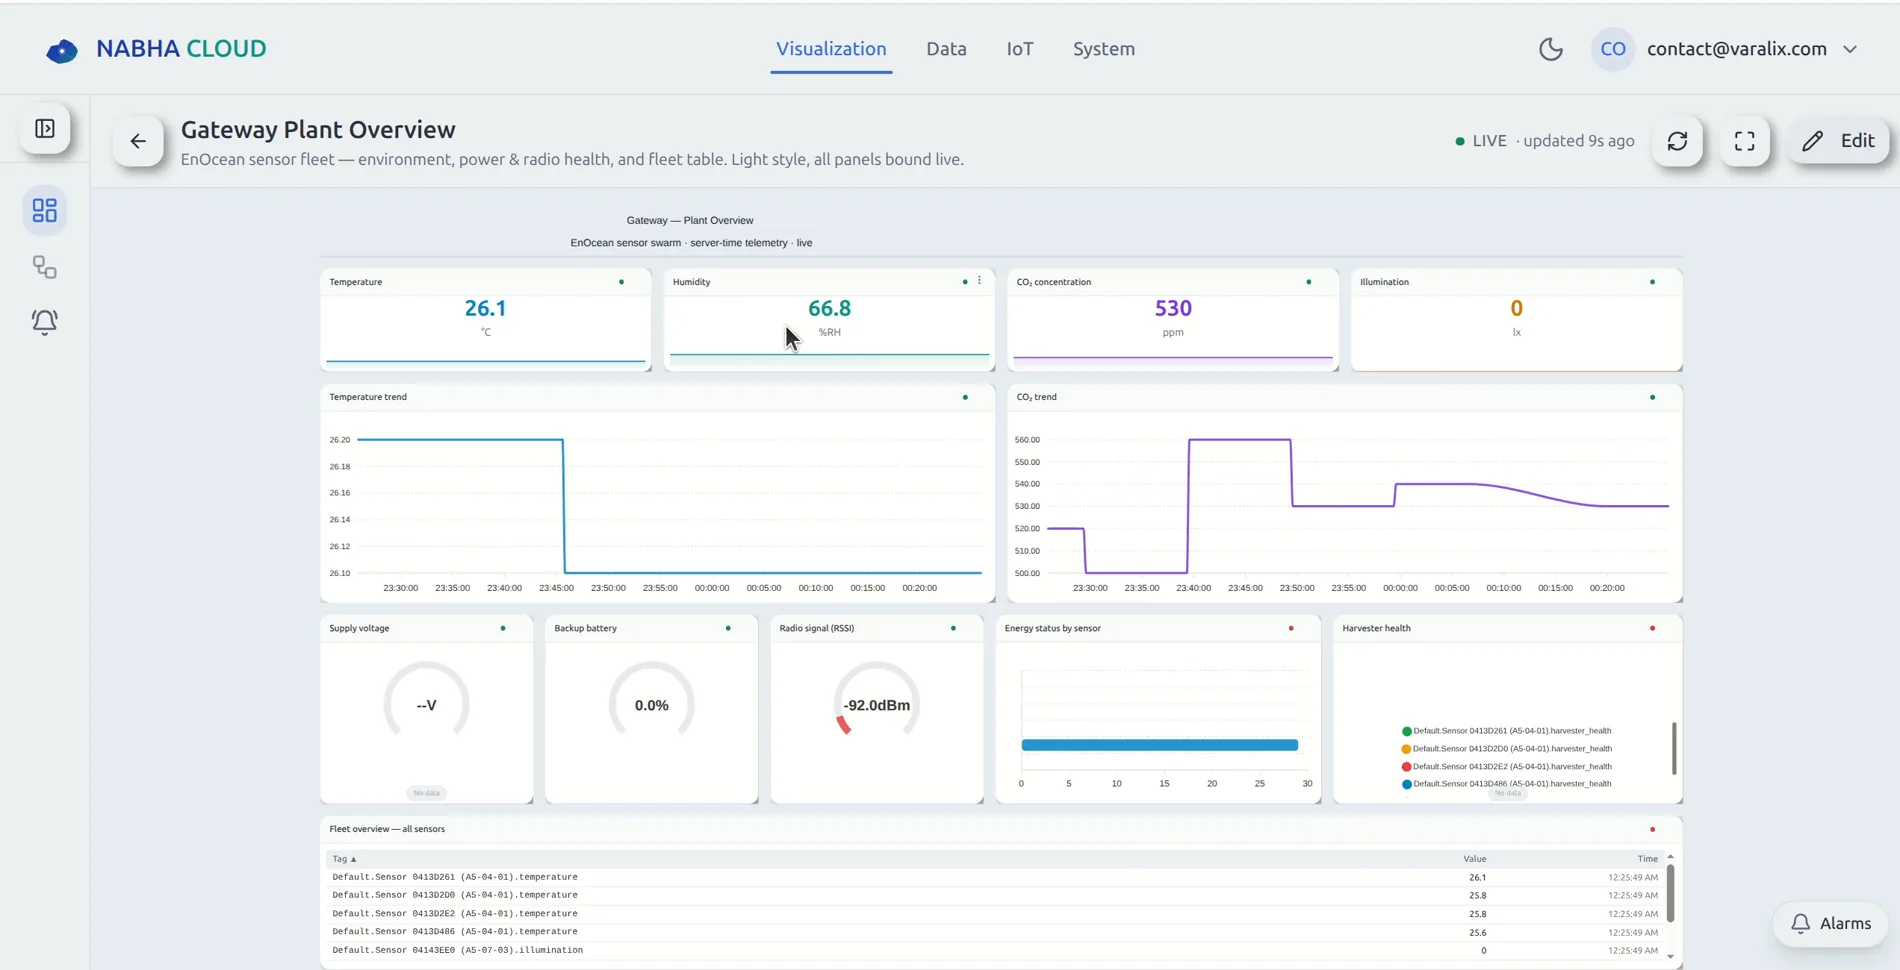
Nabha dashboard titled Gateway Plant Overview, showing live temperature, humidity, CO2 and illumination tiles, trend charts, supply voltage and radio signal gauges, and a per-sensor fleet table.
Live fleet dashboard. An EnOcean sensor swarm reporting temperature, humidity, CO₂ and illumination, with trends, supply voltage, backup battery and radio signal per node, and a fleet table underneath. Every panel is bound to live server-time telemetry.
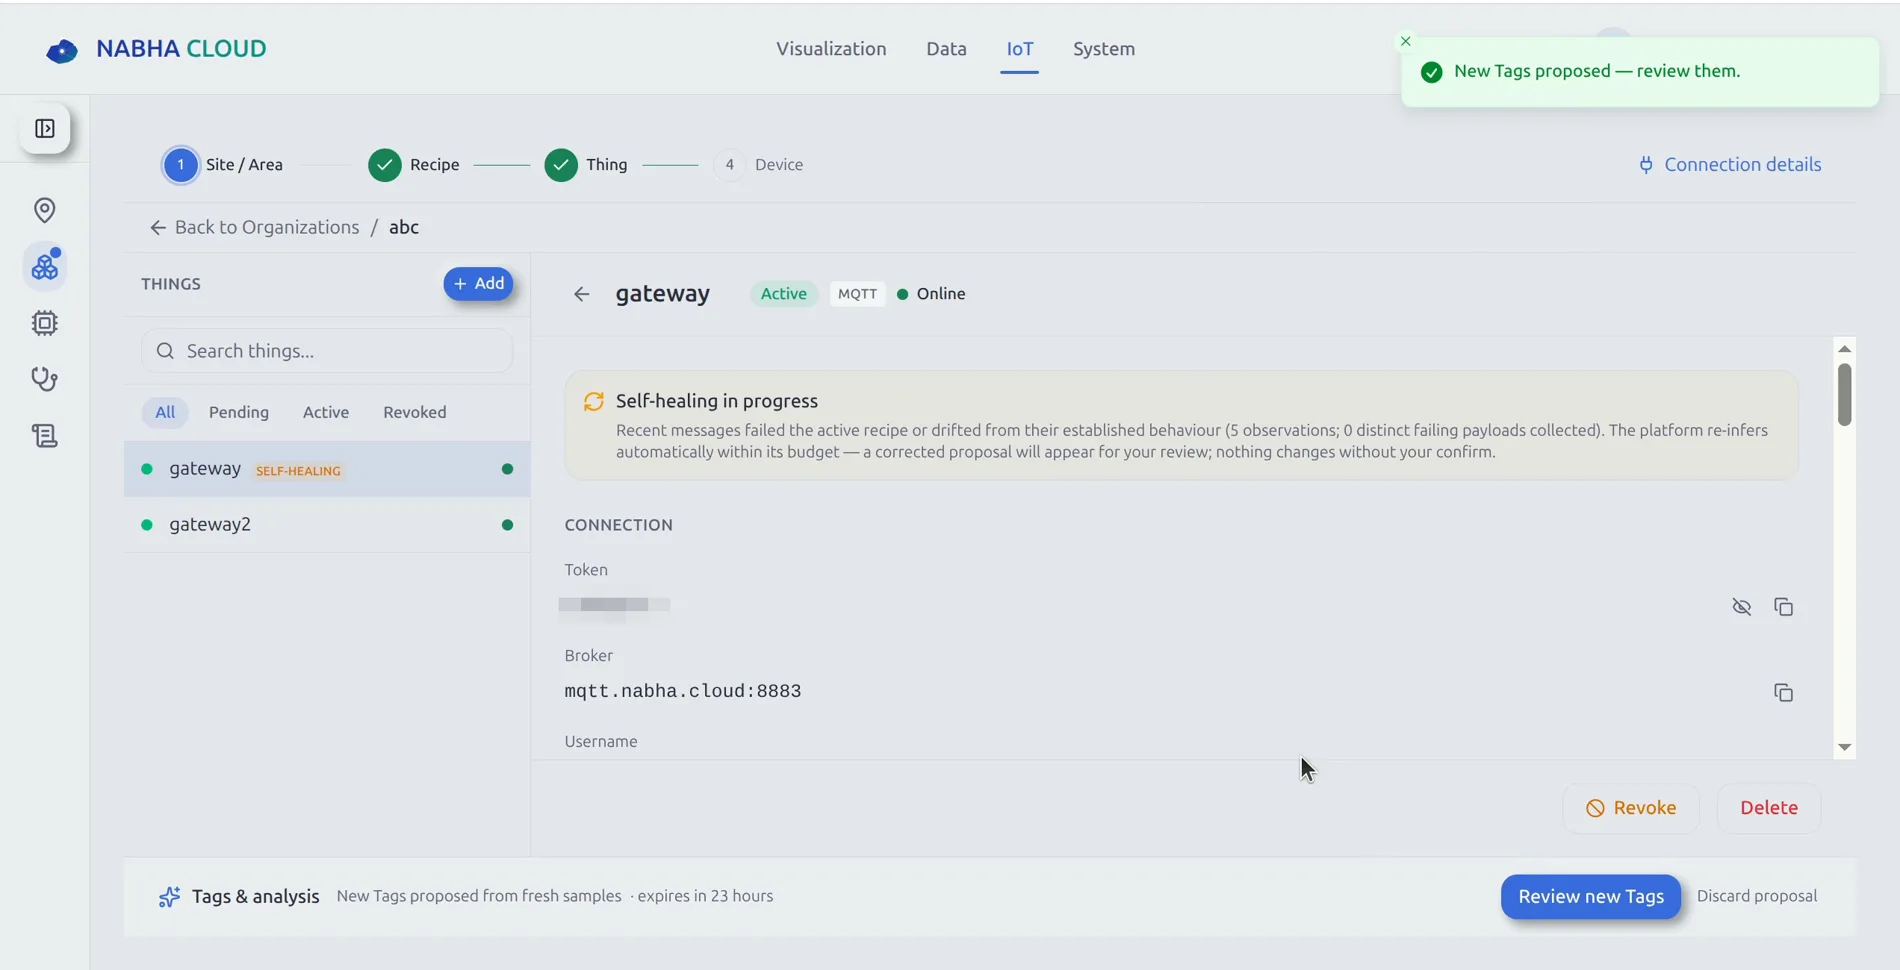
Nabha device management screen showing a gateway Thing that is Active, MQTT and Online, with a self-healing notice explaining that the platform re-infers tags automatically and proposes a correction for review.
Devices, and tags that fix themselves. A gateway connected over MQTT. When payloads drift from their established shape, Nabha re-infers them on its own and raises a proposal — nothing changes without your confirm. This is the part that removes the schema work. The connection token is masked in this screenshot.
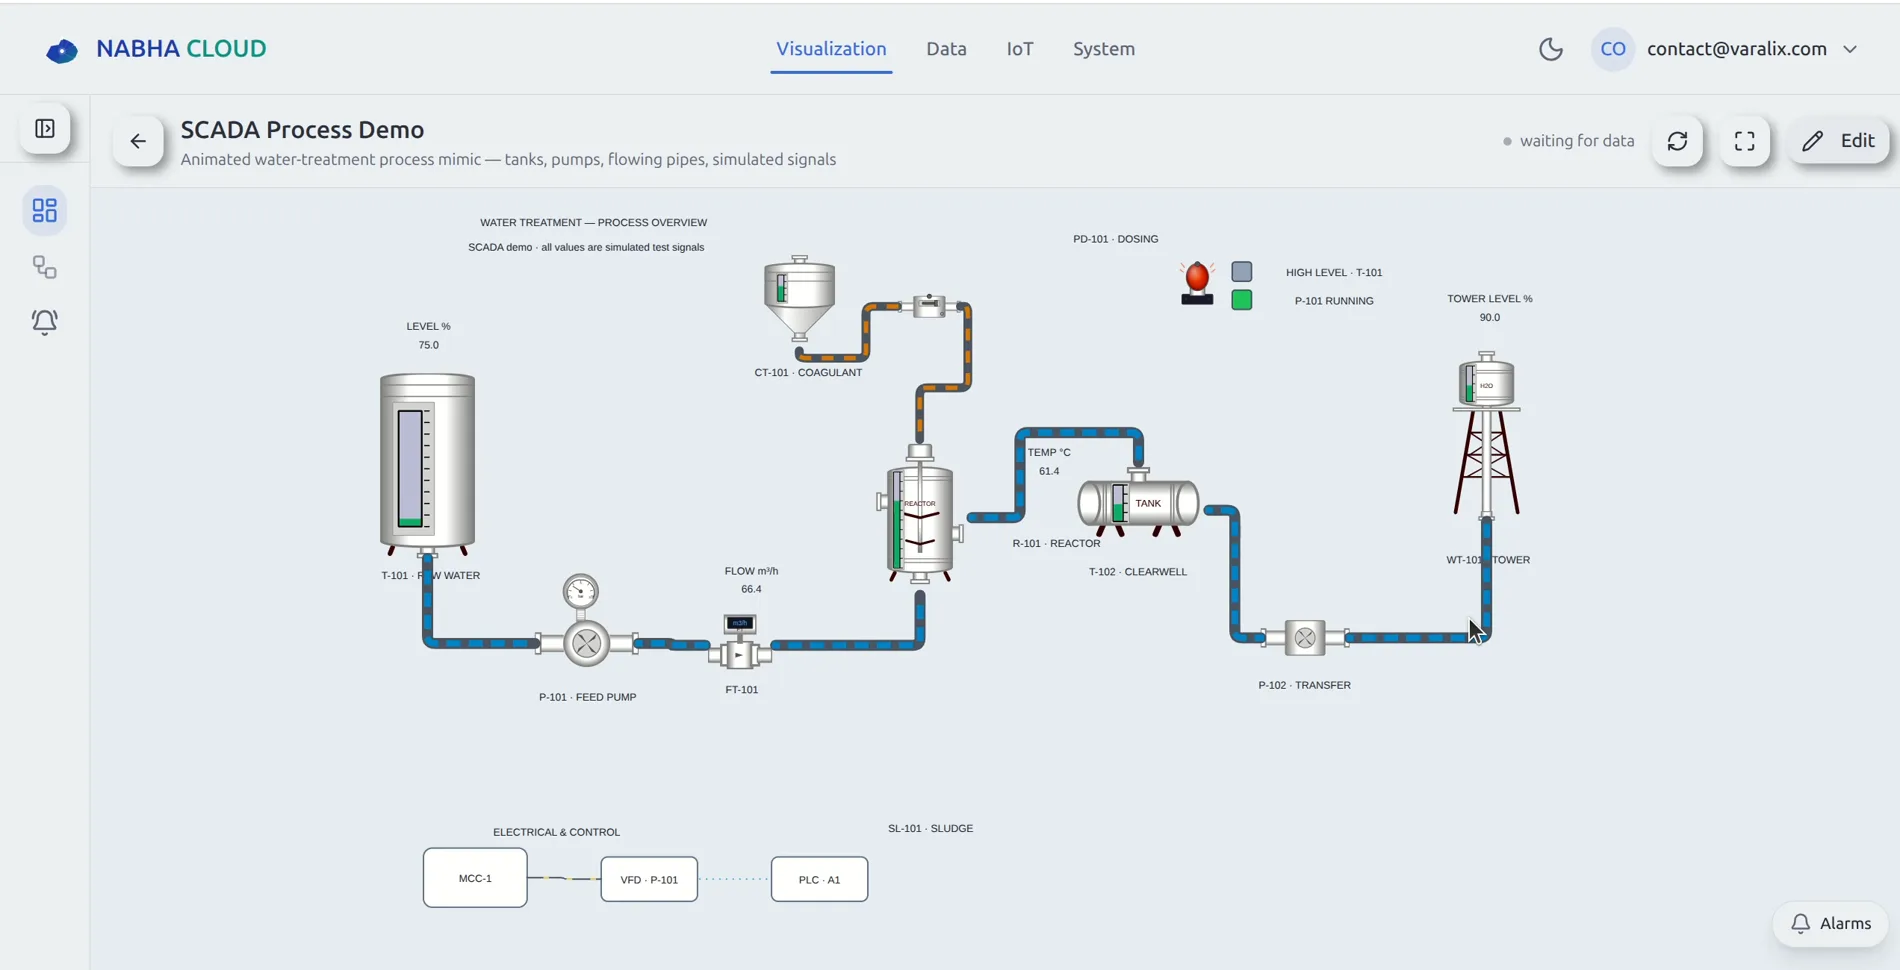
Nabha SCADA process mimic of a water treatment plant with tanks, feed pump, reactor, clearwell, transfer pump, tower and an electrical and control panel.
Process mimics. A water-treatment overview — tanks, pumps, flowing pipes, valves and the electrical and control chain, animated from the signal values behind them. This particular board runs on simulated test signals, as labelled on the screen.
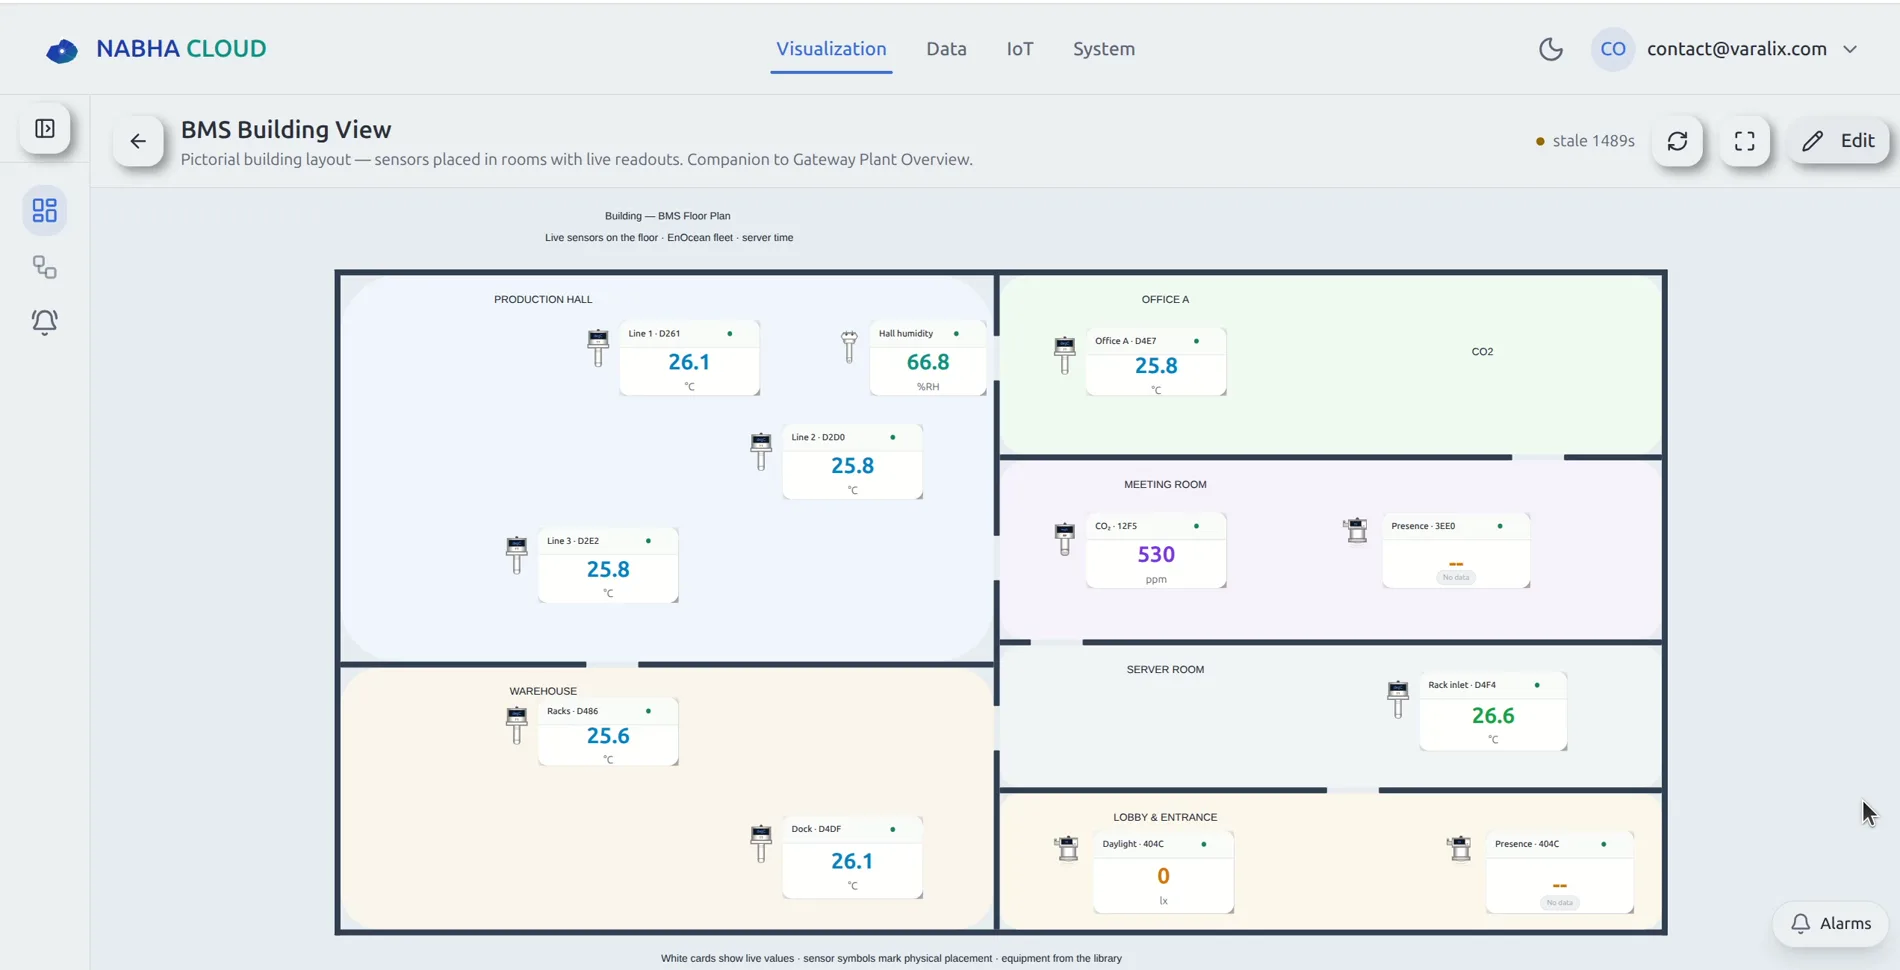
Nabha BMS building view showing a floor plan with production hall, office, meeting room, warehouse, server room and lobby, each with live sensor cards showing temperature, CO2 and presence.
Building views. The same fleet placed on a floor plan — production hall, offices, meeting room, warehouse, server room, lobby — with live readouts sitting where the sensors physically are. Sensor symbols come from the built-in equipment library.
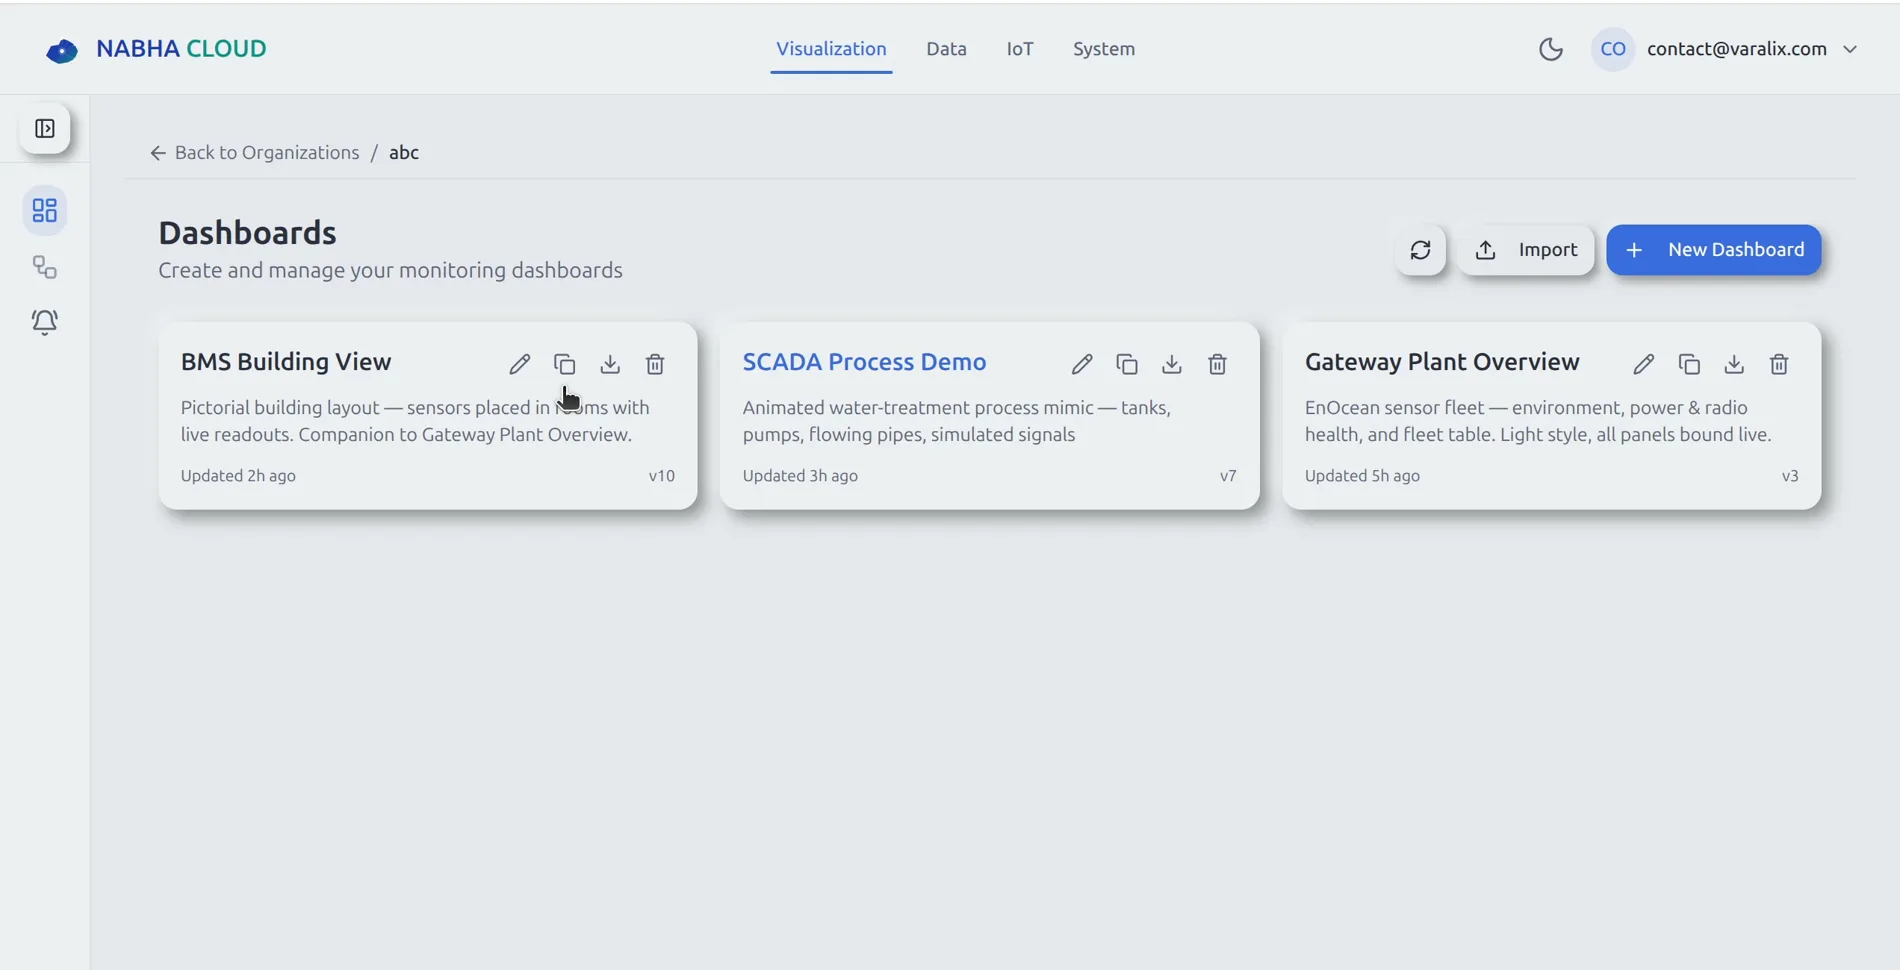
Nabha dashboards index listing BMS Building View, SCADA Process Demo and Gateway Plant Overview, each with a version number and last-updated time, plus import and new dashboard actions.
Dashboards are versioned. Build, duplicate, export and import them; every board carries a version and a last-updated stamp, so a change you regret is a revision, not an incident.
Your turn

Point a device at it and watch.

Connect your first device and Nabha reads the payload, infers the tags, and builds the board. If you have no hardware to hand, our open-source simulator will push a realistic fleet at it for you.